
How to Find the Latest Electrical Innovation Trends
Finding the latest electrical innovation trends means looking beyond product launches. The strongest signals often appear in utility investment plans, technical standards, and field data. The International Energy Agency’s Electricity 2024 report projects global electricity demand will grow by about 3.4% annually from 2024 through 2026. That rising load puts practical pressure on grids, equipment, and operators. It also makes efficiency and reliability harder to treat as separate goals.
The IEA’s 2023 report Electricity Grids and Secure Energy Transitions warns that more than 80 million kilometers of grids must be added or refurbished by 2040 to meet national climate targets. That is a major infrastructure challenge, not just a technology story. IEA Executive Director Fatih Birol described the shift this way: “The world is entering the Age of Electricity.” His phrase captures the momentum, but it does not tell us which solutions will prove durable. That distinction matters. A promising pilot may still face cost, maintenance, or integration hurdles. This guide will show readers how to track electrical innovation trends through credible reports, patent activity, utility projects, and measurable deployment results. It will also flag where evidence is thin. Trends can be exciting; they can also be overstated.
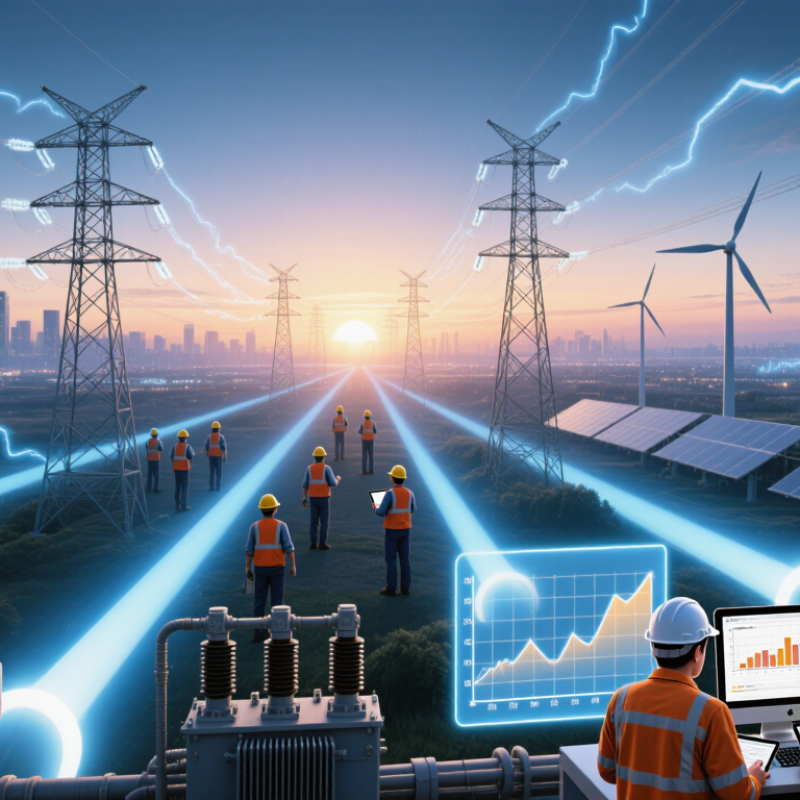
Establish the Outlook: IEA Forecasts 3.4% Annual Power-Demand Growth, 2024–26
The International Energy Agency’s Electricity 2024 report forecasts average global power-demand growth of 3.4% annually from 2024 to 2026, compared with 2.5% in 2023. That rise is not just a larger number on a chart. It means more pressure on substations, transformers, and local distribution lines during hot afternoons and evening charging peaks.
Data centers are one visible driver. The IEA estimates their electricity use could exceed 1,000 terawatt-hours by 2026, up from about 460 terawatt-hours in 2022. Electrification of transport and industry adds further demand, though the pace will vary by region. A global average can hide sharp local peaks. That matters.
The IEA’s 2023 report Electricity Grids and Secure Energy Transitions says annual grid investment needs to more than double, reaching over $600 billion by 2030. For electrical innovation, this points toward grid monitoring, flexible demand, storage, and equipment that can handle changing loads. A workshop may see this as a warm transformer or a delayed connection request, not a forecast. Forecasts are not guarantees, either; project delays and weather can shift the picture. Still, planning for steady demand growth is more credible than assuming yesterday’s load profile will hold.
How to Find the Latest Electrical Innovation Trends - Establish the Outlook: IEA Forecasts 3.4% Annual Power-Demand Growth, 2024–26
| Trend indicator | Reported data and outlook | Period | Why it matters for electrical innovation |
|---|---|---|---|
| Global electricity-demand growth | Demand is forecast to grow by an average of 3.4% per year, with consumption increasing by roughly 1,100 TWh annually. | 2024–2026 | Higher demand increases the need for generation, grid capacity, storage, and efficient use of electricity. |
| Data-centre and AI electricity use | Data centres, artificial intelligence, and cryptocurrency together used about 460 TWh of electricity in 2022; their consumption could exceed 1,000 TWh by 2026. | 2022 baseline; 2026 outlook | Rapidly growing, concentrated loads raise the value of efficient computing, reliable power connections, and flexible demand. |
| Low-emissions electricity generation | The share of global electricity generated by renewables and nuclear power is projected to rise from about 39% to around 50%. | 2023–2026 | A changing generation mix calls for grid upgrades, stronger system flexibility, and technologies that balance variable output. |
| Power-system planning priority | Meeting fast-rising demand while integrating more low-emissions generation is a central challenge in the 2024–2026 outlook. | Near-term outlook | Track investment and deployment in transmission, distribution, storage, demand response, and energy efficiency. |
Source: International Energy Agency (IEA), Electricity 2024. Figures are global estimates and forecasts; values are rounded.
Related Posts
-

2026 Top Electrical Project Planning Tips for Global Buyers?
-

What Are the Benefits of Modern Electrical Systems for Businesses?
-
China Top 10 Energy Efficiency Solutions for Global Buyers
-

What is the Best Electrical Protection Methods for Global Buyers?
-

Top 10 Electrical Troubleshooting Tips for Global Buyers?
-
China Top 10 Energy Management Strategies for Buyers?